Appears in the 4th USENIX Symposium on Networked
Systems Design & Implementation (NSDI'07), Cambridge, MA, USA, April 2007.
Copyright to this work is retained by the authors. Permission is granted for the noncommercial reproduction of the complete work for educational or research purposes.
X-Trace: A Pervasive Network Tracing Framework Rodrigo Fonseca George Porter Randy H. Katz Scott Shenker Ion Stoica |
Abstract:Modern Internet systems often combine different applications (e.g., DNS, web, and database), span different administrative domains, and function in the context of network mechanisms like tunnels, VPNs, NATs, and overlays. Diagnosing these complex systems is a daunting challenge. Although many diagnostic tools exist, they are typically designed for a specific layer (e.g., traceroute) or application, and there is currently no tool for reconstructing a comprehensive view of service behavior. In this paper we propose X-Trace, a tracing framework that provides such a comprehensive view for systems that adopt it. We have implemented X-Trace in several protocols and software systems, and we discuss how it works in three deployed scenarios: DNS resolution, a three-tiered photo-hosting website, and a service accessed through an overlay network.
Internet services are built out of distributed components (e.g., load balancer, web server, backend database), make use of sophisticated network mechanisms (e.g., VPNs, NATs, overlays, tunnels), and can span multiple administrative domains (e.g., the client's web proxy and the server's load balancer). When these complex systems misbehave, it is often quite difficult to diagnose the source of the problem.
As an example, consider the infrastructure serving Wikipedia [27]. As of June 2006, they had servers spread across 3 sites, comprising 33 web caches chosen via DNS round-robin assignments, 4 load balancers, 105 web servers, and 14 database servers. A user's request transits a cache server, and may also transit a load balancer, a web server, and a database. Caching is done at each of these levels. Now suppose a user updates a page on Wikipedia, and fails to see her updates upon reloading the page. It is difficult to identify which cache, at which level, is returning stale data. Even if logs are kept, there is no common mechanism to determine which logs to examine, or to correlate entries across multiple logs. It may also not be possible for administrators to reproduce the problem, since their requests would most likely take a different path through the system.
Diagnostic tools do exist, but many of them are limited to a particular protocol. For instance, traceroute is useful for locating IP connectivity problems, but can't reveal proxy or DNS failures. Similarly, there are numerous alarm and monitoring suites for HTTP, but they cannot diagnose routing problems. While these tools are undoubtedly useful, they are also typically unable to diagnose subtle interactions between protocols or provide a comprehensive view of the system's behavior.
To this end, we have developed an integrated tracing framework called X-Trace. A user or operator invokes X-Trace when initiating an application task (e.g., a web request), by inserting X-Trace metadata with a task identifier in the resulting request. This metadata is then propagated down to lower layers through protocol interfaces (which may need to be modified to carry X-Trace metadata), and also along all recursive requests that result from the original task. This is what makes X-Trace comprehensive; it tags all network operations resulting from a particular task with the same task identifier. We call the set of network operations connected with an initial task the resulting task tree.
Constructing the task tree requires understanding the causal paths in network protocols. While in general this may be difficult, in most of the situations we have considered so far this is relatively straightforward: for example, a recursive DNS query is clearly causally linked to the incoming request. X-Trace requires that network protocols be modified to propagate the X-Trace metadata into all actions causally related to the original task. This involves both understanding calls to lower-level protocols (e.g., HTTP invoking TCP) and initiating forwarded or recursive requests.
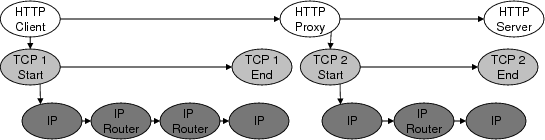
X-Trace-enabled devices log the relevant information connected with each tagged network operation, which can then be reported back. The trace information associated with a task tree gives the user or operator a comprehensive view of what network operations were executed as part of a task. To illustrate, Figure 1 shows an example of the task tree involved in a simple HTTP request through a proxy, showing the causal relations between operations in the HTTP, TCP, and IP layers. X-Trace task trees are runtime traces of a task execution, and so long as individual components are integrated into the framework, there is no need for prior configuration of their dependencies.
Diagnosing problems often requires tracing a task across different administrative domains (which we will call ADs). ADs may not wish to reveal internal information to each other, or to end users. Accordingly, X-Trace incorporates a clean separation between the client (user or operator) that invokes X-Trace, and the recipient of the trace information. For instance, when an end user notices a problem and invokes X-Trace, the trace information from her home network is delivered to her locally, the trace information from her ISP is delivered to the ISP support center, and the trace information from the web site she was accessing is sent to the web site operator. Each of these parties can then deal with the information as they see fit; sharing it with others, keeping it private, or even not collecting it at all. The fact that X-Trace gives them a common identifier for the task enables them to cooperate effectively if they so choose.
Realistically, we know all layers in the stack and different ADs will not deploy X-Trace-enabled protocols and devices simultaneously. However, individual protocols, applications, or ADs can benefit immediately from X-Trace if they support it. If a particular protocol or application gets instrumented alone, one gets horizontal slices of the task tree, which are useful for developers and users. If an AD alone deploys it on multiple layers within its network, it gets to internally visualize the portion of the task tree that happened inside of its domain. In addition, there is a “network effect” for adoption: as more protocols and networks integrate into the framework, X-Trace offers a common framework for their sharing of this information, increasing the value for all parties.
There has been much prior work on the study of application behavior, network monitoring, and request tracking. We discuss this related work in detail in Section 7 and only note here that the main differentiating aspect of X-Trace is its focus on tracing multiple applications, at different network layers, and across administrative boundaries. Section 4 highlights these features in the context of three specific examples. However, X-Trace is applicable to a wide variety of other protocols, such as SIP, RPC, and email.
While we feel that X-Trace provides a valuable service, it certainly has significant limitations. They are discussed in detail in Section 6, but we note them briefly here. First, implementing X-Trace requires modifications to clients, servers, and network devices; protocols that can't already do so must be altered to carry X-Trace metadata, and their implementations must log the relevant trace information. While these changes are conceptually simple, in practice retrofitting X-Trace into existing applications is a process of varying difficulty; our experiences in this regard ranged from trivial to quite challenging. Second, when X-Trace is only partially deployed, the ability to trace those parts of the network is impaired, sometimes entirely. Third, lost trace reports can limit reconstruction of the request tree and can lead to false positives in diagnosing faults (i.e., the lack of trace data may be interpreted as a failure). Fourth, our enforcing a tree structure on the set of network operations related to a particular task means that there are some request topologies that we cannot capture. For example, X-Trace is not able to naturally capture requests that rendezvous at a node where they are merged into a single request. It isn't clear, for instance, what should be considered causally-related in a routing protocol.
Because X-Trace only records paths that were taken, it is not a tool to assert global invariants about all possible paths. There are many problems for which X-Trace will not determine the cause, but will rather show the effect. While not an introspective debugger, it will point out the components involved in the operation, guiding the use of other tools to verify the cause. Examples of these cases are state corruptions that would cause a router to misroute packets, or an overloaded CPU that would cause a message to be dropped.
The rest of the paper is structured as follows. In Section 2, we describe the model and architecture of X-Trace. In Section 3, we describe our implementation of the X-Trace architecture. Section 4 describes three deployments of X-Trace and pinpoint six network error conditions. Section 5 discusses other uses of the system. In Section 6, we discuss the limitations of and security considerations raised by X-Trace. In Section 7, we discuss at length how X-Trace relates to previous work. Lastly, we conclude in Section 8.
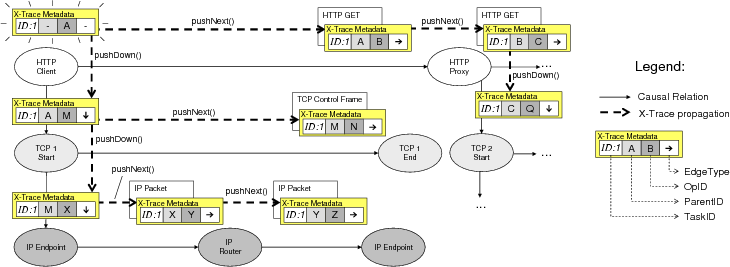
Figure 2: Propagation of X-Trace metadata in the example in Figure 1. Causal edges in the task tree are captured by the ParentID, OpID, and EdgeType fields. The TaskID remains the same for all the operations that comprise the task.
A key function of X-Trace is to reconstruct the task tree of all sub-operations making up the task. We now consider three principles that guided our design:
The first principle highlights our desire to probe what happens on the actual datapath we want to diagnose. Out-of-band probes might not end up following the same path as the original datapath. It follows that we need to add metadata to the same datapath that we want to trace. In X-Trace this metadata contains an identifier common to all operations in a task tree, which is added to messages and propagated by devices along the entire path.
This principle relates to gathering of trace information. If we appended trace information to the metadata encoded in the datapath, then we might lose this information in the event of network failure. Also, this would increase the overhead of messages. Obtaining trace data during periods of failure is especially important to this work. It follows that we need an out-of-band, orthogonal mechanism to record and collect trace data. Additionally, by decoupling trace reporting from the datapath, we lessen the impact of X-Trace on the datapath's latency.
As we discuss in §2.3 below, separating the user who inserts the X-Trace metadata in the datapath from the destination of the trace reports generated by components along the path allows for flexible disclosure policies of the trace information for each AD. Each AD keeps control of the information, while the common identifier allows them to cooperate in solving problems if necessary.
X-Trace places the minimal necessary mechanism within the network, while still providing enough information to reconstruct the path. The data itself is not kept in the network path, but rather reported to specific places determined by ADs. The X-Trace metadata contains enough information for ADs to communicate trace information back to the user if it so chooses.
In the following section, we describe the format and structure of the tracing metadata introduced by our system, as well as the way that metadata is propagated through applications.
X-Trace metadata is the information placed into each layer to support the X-Trace framework. It is inserted into a network task by the client, if it is X-Trace capable. For legacy clients, devices in the network can add them. Network operators can insert X-Trace metadata for operations traversing their AD.
Within that metadata is a task identifier, which uniquely identifies each network task. This identifier should be unique among all of the reports accessed by an X-Trace user. X-Trace metadata is carried by the extension, option, or annotation fields within each network protocol. Examples of such fields are IP options, TCP options, and HTTP headers. It is replicated across layers, ensuring that devices on the path can access it without having to violate layering.
The metadata contains an optional field, TreeInfo, used by nodes to record causal relations between operations. It consists of a three-tuple: (ParentID, OpID, EdgeType). ParentID and OpID encode edges in the task tree. The EdgeType field indicates the type of that edge: either connecting two adjacent nodes at the same layer, or between a node at one layer with a node at a lower layer. The ParentID and OpID fields should be unique with respect to one task identifier. We describe how network devices manipulate these fields below. An optional destination field is used to send trace data to interested parties. This is described in detail in below, and its security implications are addressed in Section 6.
Figure 2 shows in full detail the contents and the propagation of X-Trace metadata (described in the next section) in part of the task tree from Figure 1. In particular, the successive values of the ParentID, OpID, and EdgeType fields allow the complete task tree to be reconstructed for this TaskID.
Propagation: pushDown() and pushNext() Devices and network elements on the path are responsible for propagating the X-Trace metadata along the path using two simple primitives: pushDown() and pushNext(). These primitives have the goal of ensuring that X-Trace metadata stays with the datapath. They manipulate the TreeInfo field of the X-Trace metadata, as shown in Table 1, recording the causal relations between operations in the path. The table shows how the fields in the current X-Trace metadata are mapped into the next metadata, for both primitives. The unique() function returns an identifier that is unique in the context of one TaskID.
The pushDown() primitive is responsible for copying X-Trace metadata from one layer to the layer below it. In Figure 2, all of the vertical arrows represent pushDown() operations. In this case, the HTTP proxy has to call pushDown() to copy the metadata into the newly generated TCP 2 connection. Likewise, the TCP process in the proxy has to call pushDown() to copy this metadata down to the new IP path. Note that we do not make any a priori assumptions as to the number or ordering of layers in a protocol exchange: pushDown() works recursively, with each layer only naturally interacting with the layer immediately below.
pushNext() is a primitive used by nodes on the datapath to propagate X-Trace metadata to the next hop in the same layer. In Figure 2, the HTTP proxy creates a new HTTP connection to the server. It calls pushNext(), which copies the metadata into the headers of that new connection, and captures the causal link between the two. All horizontal edges in the figure are pushNext() operations at their respective layers.
Since the X-Trace metadata is embedded into the messages at each layer, propagation happens at the same time as the messages are sent. In particular, if messages are stored for later forwarding, as is the case with email messages [10], the causal relations will still be preserved and recorded properly.
TreeInfo operations pushNext() next.parentID ⇐ current.opID next.opID ⇐ unique() next.type ⇐ NEXT pushDown() next.parentID ⇐ current.opID next.opID ⇐ unique() next.type ⇐ DOWN
Table 1: Effect of both propagation primitives mapping a current X-Trace metadata to a next metadata. unique() returns an ID unique within one task.
When a node sees X-Trace metadata in a message at its particular layer, it generates a report, which is later used to reconstruct the datapath. This report generation operation is separate from propagating X-Trace metadata, and is specific to the tree reconstruction aspect of our application.
Reports contain a local timestamp, the TaskID they refer to, and information that is specific to the node sending the report. Devices only report information accessible at their own network layer. For example, an HTTP cache may report on the URI and cookie of the request, and the action taken upon receiving the request. It can also add systems information such as the server load at the time. IP routers, on the other hand, report information contained in the IP headers of packets, such as source and destination addresses, and can add other relevant performance information such as current queue lengths.
The reports generated by devices within one AD are kept under the control of that AD, according to its policy. That policy could be to store all the reports in local storage, such as a database. The AD can use this store of reports to diagnose and analyze flows transiting its network. Section 4.2 shows how a web hosting site uses locally generated and stored reports to diagnose faults in its components.
The X-Trace metadata has an optional Destination field. If present, this field signals that a user (located at that destination) is interested in receiving the trace data as well. This user might be the client, or it could be any delegated report server. This indirection is useful for users behind NATs, since they are not addressable from the Internet. The AD uses its policy to respond to this request. The simplest policy is for each device to just send reports directly to the indicated destination, which would collect them and reconstruct the task tree. This may not be desirable, though, because AD's in general will want to control who has access to what granularity of data. One possible mechanism that uses indirection works as follows. The AD still collects all reports locally in a private database. It then sends a special report to the user, containing a pointer to the report data. The pointer could be the URL of a page containing the trace data. This gives each AD control of the visibility of the trace information, by requiring users authenticate themselves when they fetch the data. The AD can make use of this authentication information when choosing the level of detail of the report information returned to the user. We describe this usage in more detail in Section 3. Note that all the information needed to get a report to a user is kept in the X-Trace metadata, meaning that nodes in the network do not need to keep any per-flow state to issue reports.
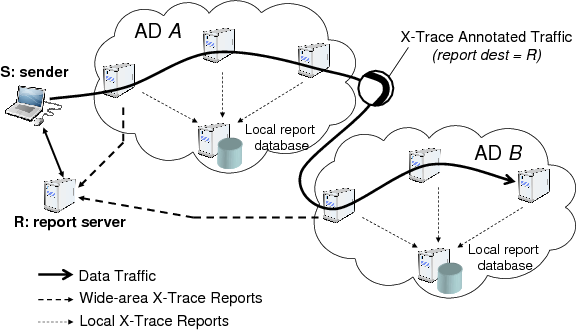
Figure 3 shows a sender S who sets the destination for reports as being the report server R. ADs A and B send pointer reports to R, and either the client or R itself fetches these reports later. A special case is when the user of X-Trace is in the same AD as the devices generating reports, such as network operators performing internal troubleshooting. X-Trace metadata gets added at the AD ingress points. The network operators go directly to the local report databases, and there is no need to use the destination field in the metadata.
Task tree reconstruction is an offline process performed by the user that reconstructs the request path of the data connection. After the user collects reports from the reporting infrastructure, they examine them to reconstitute the request tree. Each of the reports is treated as a directed edge, either a “down” edge or a “next” edge, corresponding to pushDown() and pushNext() operation. After reconstructing the tree, the client can examine the nodes and paths that the request took. For transitory errors, this tree serves as a permanent record of the conditions that existed at the time of the connection. Additionally, any performance data included by the devices in the reports can be used to correlate failures in the datapath with devices that may be under-performing due to overload.
The reconstructed tree is the end product of the tracing process, and can be stored, associated with trouble ticket systems, or used by operators as a record of individual failure events for reliability engineering programs.
In this section we describe how we implemented the architecture described above. We discuss the representation of the X-Trace metadata and its propagation, a local reporting infrastructure, and a prototype for inter-AD reporting, as well as a simple procedure to reconstruct a task tree from a series of reports. We present some micro-benchmarks, and close the section with a discussion of issues that arise when integrating X-Trace into new and existing protocols and applications.
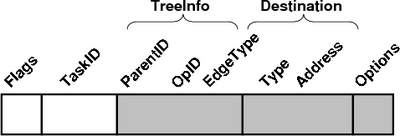
Figure 4 shows the format with which we encode the X-Trace metadata. It consists of two required fields, and three optional ones:
The flags field contains bits that specify which of the three optional components of the X-Trace metadata are present: TreeInfo, Destination, and Options.
Our design supports 4, 8, 12, or 20 byte integer fields to represent the TaskID. The TaskID must be unique within 1) a window of time, and 2) a reporting domain. The window of time must be long enough so that no two tasks that overlap in time share the same ID.
(Optional) The TreeInfo field holds three subfields: ParentID, OpID, and EdgeType. ParentID and OpID are each 4 bytes long. These IDs must be unique within the context of a single task ID. We implement the unique() function as a random number generator. The EdgeType field is implemented as one byte, with only two values currently encoded: NEXT and DOWN.
(Optional) X-Trace metadata can optionally contain a destination, which is a network address that X-Trace reports should be sent to, as described in Section 2.3. The Destination field consists of two portions, a type, and an address. Currently implemented types are shown in Table 2.
(Optional) To accommodate future extensions to the X-Trace identifier format, we include an options mechanism. The Options block, if present, consists of one or more individual options. Each consists of a type, a length, and then a variable length payload.
A report is an ASCII message consisting of a header section followed by a body section. The first line of the header identifies the layer issuing the report. The rest of the headers are specified as key-value pairs, similar to headers in RFC 822 [10]. The body of the report is free-form, and the content is set by the device issuing the report and other operator policy.
Included with X-Trace is libxtrreport, a reference implementation of a client library that can be linked into applications for issuing reports. This library is very thin, and simply relays reports to a locally running daemon process.
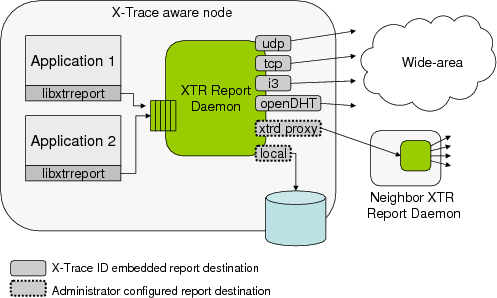
The report daemon (see Figure 5) uses a UDP socket to listen for reports from the libxtrreport library. A thread listens for these reports, and places them on a queue. Another thread pulls reports off this queue, and sends them to the appropriate handler module. These modules, which run in separate threads, can forward the report to another report server, send it to a service like OpenDHT [21], or send it to any of the other destinations listed in Table 2. For local destinations, we make use of a Postgres SQL database for report storage.
We also implemented a packet sniffing application that can send reports on behalf of services and applications that cannot be modified to include libxtrreport. This application snoops network traffic using the libpcap library, sending reports for any protocols that it supports. Currently, this application supports the IP and TCP protocols. Network switches can make use of port mirroring to mirror traffic to this agent.
We implemented a special case of Inter-AS reporting in the web hosting scenario described in Section 4.2. The front end webservers included two HTTP headers in the response sent back to the client. The first contains a URL for collecting trace information about the request. The second is the X-Trace task identifier associated with the network operation. This is included to simplify handling at the client, as well as for environments in which the X-Trace metadata was added by the frontend webservers. We wrote a Firefox extension that reads these HTTP headers, and provides the user with a visual indicator that the page they are visiting is “X-Trace enabled”, as well as a button they can click to fetch the trace data from the provided URL.
Our implementation of the task tree reconstruction is quite simple, and can serve as the foundation for other, more complex, visualizations. We initially start by building a graph, G, consisting of the node represented by the first report. For each additional report we receive, we look for its parent (given by its IDparent field) in the tree. If this new node's edge type is NEXT, we attach the node on the same level as the parent. If the node type is DOWN, we attach the node at the level below the parent.
We tested the performance of the metadata propagation and the reporting aspects of our reference implementation of X-Trace. For the propagation, we measured the latency of pushNext(). This operation is blocking, and if implemented in a router, would have to be performed on a per-packet basis on the forwarding path.
We implemented pushNext() in the C language and tested it on a 64-bit Intel Pentium 4 CPU running at 3.2 GHz. We applied pushNext() to 576-byte packets, and found the average time required to be 0.71 µ s. Taken in isolation, this processor could apply the operation to over 1.4 million packets per second. In fact, hardware implementations could be much faster.
To test the performance of the reporting infrastructure, we used the Apache web benchmarking tool, ab, against two otherwise identical Apache websites: one with reporting turned on and one without. The report store in this test was a separate Postgres database. Of the 10,000 requests we issued to the site, none of the reports were dropped by the reporting infrastructure. The regular server sustained 764 requests/sec, with a mean latency of 1.309 ms. The X-Trace enabled server sustained 647 requests/sec, with mean latency of 1.544 ms, which shows a 15% decrease in total system throughput.
Adding X-Trace support to protocols and applications involves three steps: (i) adding X-Trace metadata to messages exchanged, (ii) adding logic to propagate the X-Trace metadata within the implementation, following causal paths, and (iii) optionally adding calls to generate reports at interesting points of the message flow.
To support X-Trace, a layer or application must embed X-Trace metadata in the messages it exchanges with peers. The difficulty of this for existing protocols depends on their specification. For example, it is simple for HTTP, because its specification [11] allows for extension headers, and dictates that unknown extensions be forwarded unmodified to next hops by proxies. Other protocols like SIP [22], e-mail [10], IP, TCP, and I3 share this characteristic. For protocols without an extension mechanism, one has to resort to either changing the protocol or overloading some existing functionality. In the implementation of Chord that comes with I3 we had to create a new type of message. Table 3 gives details on adding metadata to these and some other protocols.
Table 3: Support for adding metadata to some protocols. We have implementations for the protocols in italics.
Protocol Metadata Comment HTTP, SIP, Email Extension Header Out-of-the box support for propagation. The only change is for causal relations. IP IP Option Automatic propagation. Dropped by some ASs, wide-area support varies [12]. TCP TCP Option One-hop protocol, no next hop propagation. Linux kernel changes are needed. I3 I3 Option Support for options, but had to add handling code. Chord1 No support Mirrored augmented call path for new X-Trace data message. DNS EDNS0 OPT-RR The EDNS0 [26] extension to DNS allows metadata to be added to messages. SQL SQL Comment Possible to encode X-Trace metatada within a SQL comment. UDP, Ethernet No support Must change protocol or use shim layer.
- 1
- The Chord implementation bundled with the I3 distribution.
Applications must support two aspects of X-Trace identifier propagation: (a) carrying X-Trace metadata between incoming and outgoing messages, and (b) manipulating the metadata with pushDown() and pushNext() operations to correctly record the causal relations. We implemented support in C/C++, Java, and PHP for easily manipulating X-Trace metadata, including performing the pushDown() and pushNext(), such that few lines of code need to be added to perform (b), once (a) is in place.
In our experience, we found that capturing the causal connections within the application presented the highest variability in difficulty, as it requires understanding how received messages relate to outgoing messages, and may require following long chains of calls within the implementation. If the implementation associates a context data structure with the processing of a message, it may be easy to add X-Trace metadata to the data type, which gets carried with the processing flow automatically. Apache and I3 fall into this category. Other implementation structures require more work, as in the case of Chord: we had to create a parallel path of functions with an extra X-Trace metadata parameter following the call path from receiving the message until sending it. Instrumenting concurrency libraries and runtime environments may ease or automate this propagation [9, 20, 8]. We are currently adding X-Trace support for libasync [17].
The pseudo-code shown in Figure 6 shows a typical example of the calls that are needed for full identifier propagation in the forwarding function of an application. We assume that the message abstract data type provides methods for getting and setting X-Trace metadata in the message, and that the lower layer also provides an API to set the X-Trace metadata for its messages. This example is patterned on the code we implemented in the applications and protocols we modified.
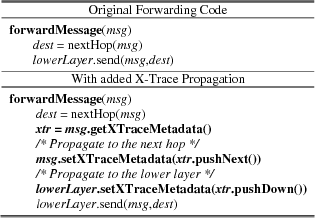
Figure 6: Pseudo-code highlighting changes for capturing causal relations with X-Trace
The remaining task is to get network elements – devices, protocol stacks, and applications – to issue reports of interesting events. For hardware devices like routers and appliances, one needs to modify the software running on the control processor. However, using the feature of port mirroring in switches, a network administrator can insert nodes that would report on traffic seen without slowing down the data path. The routers would still have to do the propagation, but not bother to call reporting functions. For software implementations, it is straightforward to integrate the reporting library, which is similar to adding a logging subsystem to the application.
In this section, we describe several scenarios where X-Trace could be used to help identify faults. We discuss three examples in detail–a simple web request and accompanying recursive DNS queries, a web hosting site, and an overlay network. We deployed these examples within one AD, and thus do not make use of the wide-area reporting mechanism. We follow these examples with a description of other scenarios.
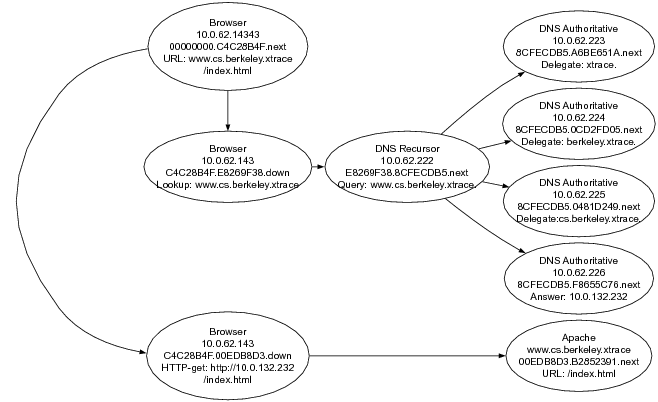
The first scenario that we consider is that of requesting a web page from a server. Figure 7 shows the tree corresponding to a simple web request. The user starts by typing a URL into her browser, in this case http://www.cs.berkeley.xtrace/index.html. The browser's host first looks up the provided hostname using a nearby DNS resolver, which returns the IP address of that host (10.0.132.232). If the resolver does not have the requested address in its cache, it will recursively contact other DNS servers until a match is found. It can then issue the HTTP request to the resolved IP address.
Tracing each of these “subtasks” is a challenge: HTTP requests could be forwarded through proxies or caches, masking their ultimate destination. DNS requests are recursive in nature, are cached at intermediate servers, and span different administrative domains. This can easily lead to misconfigurations and inconsistent views.
We added support for X-Trace to the DNS protocol by using the EDNS0 [26] extension mechanism. This backwards-compatible mechanism allows metadata to be associated with DNS messages, and is increasingly supported in the wide area. We modified a DNS client library, an authoritative DNS server, as well as a recursive DNS resolver to support X-Trace metadata propagation and reporting.
We deployed this software in our local testbed, and created a parallel top-level domain (.xtrace). Figure 7 shows the final tree. In this example, the task has two subtasks, indicated by pushDown(): resolving the name, and fetching the page. A Java-based web browser issues the query to the DNS client library, which encapsulates the X-Trace metadata (after calling pushNext()) in an EDNS0 field of the query. This query is forwarded to the resolver on 10.0.62.222, which recursively looks up the address in other, authoritative nameservers, after calling pushNext() at each step of the recursion. Lastly, each of our authoritative nameservers issues reports when they receive queries with X-Trace/EDNS0 records in them. When the name resolution is complete, the browser issues an X-Trace enabled HTTP query (after calling pushNext()).
An X-Trace enabled DNS might uncover several faults that are difficult to diagnose today. At each step of the recursive resolution described above, servers cache entries to reduce load on the top-level servers. A misconfigured or buggy nameserver might cache these entries longer than it should. If a server's IP address changes, these out-of-date servers might return erroneous results. A trace like that in Figure 7 would pinpoint the server responsible for the faulty data.
Faults could occur in the HTTP portion of the task as well. We describe the application of X-Trace to web traffic in the following section.
The second scenario that we consider is a web hosting service that allows users to post and share photographs. We deployed an open-source photo application in our network on an IBM Bladecenter. The front-end webserver host Apache and PHP. The photos, metadata, and comments are stored in a Postgres database. Also included are a cache and load-balancer. The photo site has attracted approximately 200 visitors a day for a period of two months.
For this site to support X-Trace, we implemented a reporting module for Apache, and one for Postgres. To support legacy web clients, we implemented an “X-Trace headers” module that inserted X-Trace headers into requests from the legacy clients.
X-Trace can be invoked by either end users or by the operator. End users can invoke X-Trace in two ways: by using an X-Trace-enabled web browser, or an X-Trace-equipped web page. We implemented an X-Trace toolbar for the Firefox web browser that puts X-Trace metadata in requests. We also implemented a Javascript/PHP library that added a feature to selected webpages in the site that let the user report problems via an HTML form. These reports were internally coupled with the X-Trace metadata of the user's request, enabling the network operator to match their complaint with a trace of their session. This is a powerful mechanism to detect semantic faults that would appear normal from the web site's perspective, such as stale pages or logic errors in a well formed response. This is not necessary for all faults, since many requests might generate anomalous task trees that can be analyzed with methods such as Pinpoint [9].
The client application (i.e., Firefox with our X-Trace extension) creates a new X-Trace metadata and initializes its TreeInfo fields. It issues an annotated request to the front-end cache. This cache issues a report based on fields in the request and the X-Trace metadata. It calls pushNext() on the metadata, and forwards it on, possibly to other middleboxes such as load balancers that might also be on the path. When the Apache process on the front-end tier receives the request, it issues a report that includes the URL, status code, and time of the request.
The PHP-based photo software creates SQL statements to retrieve images and metadata from the backend database. We modified this code to retrieve the X-Trace metadata from the array of HTTP headers and call pushNext() on it. The new metadata is propagated to the database by enclosing it in a SQL comment (i.e., /* X-Trace:023A2E... */). The query is sent to the database, which looks for embedded X-Trace metadata. It calls xtr_report() with the query as the payload of the report. When the webserver sends the response back to the client, it adds two headers to the response: one has the X-Trace metadata (in case it was generated by the webserver), and the other has a URL that the client can access to examine the trace of the request.
If any additional requests are generated because of that response (e.g., for images), the Firefox extension will use the same TaskID. For clients that don't support X-Trace, then each request (including images) will be considered independent.
In this section we introduce several faults into the photo hosting site. These are based on first-hand experience that we had with our deployed system.
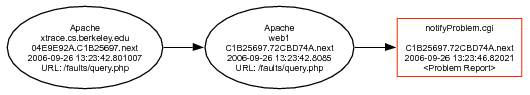
The first fault we consider is that of a malfunctioning PHP script on the front-end web servers. From the user's point of view, this could either be a fault in the PHP script, or a fault in the database. Examining Figure 8 shows immediately that the fault is the former–there are no reports from the database, pinpointing the problem to the PHP script. Figure 8 shows a square node that represents a problem report issued by the user, using the PHP/Javascript web problem reporting tool. In addition to triggering an alarm for the operator, the report node indicates which page caused the problem, in this case, /faults/query.php, located on web1.
Next, based on the Wikipedia example, we implemented a web cache that inadvertently returns stale images from its cache. Diagnosis in this case is simple. The request trace will include nodes up to and including the cache, but will not include the origin server.
The last fault we consider in this scenario is that of a malfunctioning web load balancer, which sends traffic to a server that doesn't contain the appropriate content. When users request pages from the site, they will sometimes get the pages they wanted, while other times they will get 404 File Not Found errors. In both cases, the load balancer issues a report with the request URL. Successful requests also include reports from the working web server and backend database, while unsuccessful requests only include a report from the web server.
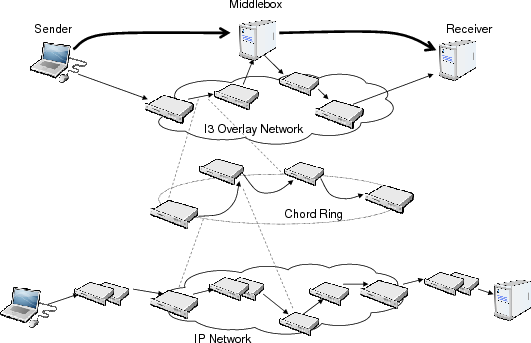
The third scenario we look at in some detail is an overlay network. Overlay networks are routing infrastructures that create communication paths by stitching together more than one end-to-end path on top of the underlying IP network. Overlays have been built to provide multicast [13], reliability [2], telephony [22], and data storage [25] services. It is difficult to understand the behavior and diagnose faults in these systems, as there are no tools or common frameworks to allow tracing of data connections through them.
In our example, we use the I3 overlay network [24]. For our purposes, it suffices to say that I3 provides a clean way to implement service composition, by interposing middleboxes on the communication path. The implementation of I3 we used runs on top of the Chord DHT [25], which provides efficient routing to flat identifiers and is an overlay network on its own.
We added X-Trace metadata to the I3 and Chord protocols, code to perform the pushNext() and pushDown() propagation operations, as well as calls to the X-Trace reporting library. The scenario topology is shown in Figure 9, and consists, at the highest layer, of a very simple protocol involving a sender, a receiver, and a middlebox interposed in the path by the sender. We used a toy protocol we called SNP – Simple Number Protocol – that is simply sending a number to the other party. The middlebox adds 10000 to any number it receives and forwards the request on, but it could also be, say, an HTTP proxy or a video transcoder. SNP also carries X-Trace metadata in its header. Each segment of the path in the SNP layer corresponds to a complete I3 path. Each I3 path, in turn, is formed by a combination of IP and Chord paths. Finally, each Chord path is formed by a combination of IP paths.
(a) Tree for normal operation
(b) Fault 1: The receiver host fails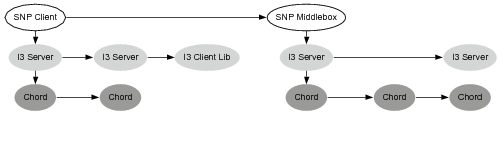
(c) Fault 2: Middlebox process crash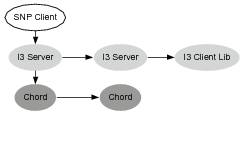
(d) Fault 3: The middlebox host fails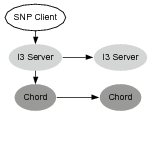
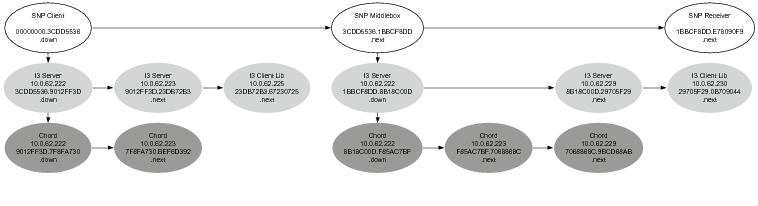
Figure 10: (a)X-Trace tree corresponding to the i3 example scenario with a sender, a receiver, and a sender-imposed middlebox. (b), (c) and (d) correspond respectively to faults: a receiver crash, a middlebox process crash, and a crash of the entire middlebox machine.
In Figure 10(a) we show the reconstructed tree of operations given by X-Trace in a sample run of the scenario. This tree was generated from X-Trace reports by the visualization tool we developed. We deployed an I3 network consisting of 3 machines, each of which was also Chord node. The SNP client, receiver, and middlebox are on separate machines. We omit the IP report messages: all IP paths are one hop, since the machines were all on a switched LAN.
The SNP client sends a message to the the SNP receiver (see Figure 10), and it interposes the SNP middlebox on the path. The following is a detailed look at the transmission of a message in this scenario.
The SNP client creates a message, chooses a TaskID and includes X-Trace metadata in the SNP header. It chooses the I3 identifier stack (IDmiddlebox, IDserver) as the destination (an identifier stack is simply a source-routed path in I3). The client calls pushDown(), copying the metadata into the I3 layer. Two more pushDown() operations copy it into the Chord and IP layers. The message is sent to the first I3 server, in this case at address 10.0.62.222. That server receives the message, and as it goes up the network stack, each layer generates and sends a report. The I3 server routes a message to the middlebox's I3 identifier, stored in the server 10.0.62.223. The I3 layer has a mapping between IDmiddlebox and the IP address 10.0.62.225. This message is delivered over IP to the I3 Client Library on that node, and then to the SNP Middlebox process.
The middlebox receives the message and processes it, sending a report from each of its layers. It removes its I3 address from the identifier stack, leaving only the address of the server, IDserver. Like the client, it calls pushNext() on the identifier, and then pushDown() twice to propagate that ID to the Chord and IP layers. The next Chord node in the path, 10.0.62.223, receives the message and calls pushNext(). It sends a report, and then since there is no I3 layer, it simply forwards the message on. This process continues for the next I3 server, and finally the message is received by the receiver. At the receiver, we see a report from the I3 client library, and from the SNP application.
In Figures 10(b), (c), and (d) we injected different types of faults and show how the resulting X-Trace tree detected them. We failed different components of the system that prevented the receiver from receiving the message. Normally it would be difficult or impossible for the sender to differentiate between these faults.
Fault 1: The receiver host fails In Figure 10(b) we simulated a crash in the receiver. I3 expires the pointer to the receiver machine after a timeout, and the result is that the message gets to the last I3 server before the receiver, but there is no report from either the SNP Receiver or I3 Client library at the receiver machine.
Fault 2: The middlebox process fails In Figure 10(c) we simulated a bug in the middlebox that made it crash upon receiving a specific payload and prevented it from forwarding the message. We see here that there is a report from the I3 Client library in the third I3 report node, but no report from the SNP middlebox or from any part of the tree after that. This indicates that the node was functioning at the time the message arrived. However, the lack of a report from the middlebox, coupled with no reports thereafter, points to the middlebox as the failure.
Fault 3: The middlebox host fails Finally, in Figure 10(d), we completely crashed the middlebox process. I3 expired the pointer to the machine, and we see the message stop at the last I3 server before the middlebox. The lack of any reports from the middlebox node, as well as no reports after the tree indicate that the entire node has failed.
Here we describe, in much briefer form, other scenarios where X-Trace could be used. This list isn't meant to be exhaustive, merely illustrative.
A tunnel is a network mechanism in which one data connection is sent in the payload of another connection. Two common uses are IPv6 and Virtual Private Networks (VPNs). Typically, it is not possible to trace a data path while it is in a tunnel. However, with X-Trace, the tunnel can be considered simply an additional layer. By calling pushDown(), the tunnel itself will contain the X-Trace identifier needed to send trace data about the tunnel to the sender.
For consumers connecting to the Internet via an ISP, diagnosing connectivity problems can be quite challenging. ISP technical support staff members have to spend time trying to determine the location of faults that prevent the user from successfully connecting. Complicating this process is the myriad of protocols necessary to bring the user online: DHCP, PPPoE, DNS, firewalls, NATs, and higher layer applications such as E-mail and web caches.
By including X-Trace software in the client, as well as X-Trace support in the equipment at the premises, the ISP can determine the extent to which the user's traffic entered the ISP. This can help quickly identify the location of the problem, and thus reduce support costs.
An enterprise network might want to trace the link layer, especially if there are highly lossy links such as a wireless access network. The effect of faults in these networks can have a profound effect on higher layer protocols, especially TCP [5]. Retrofitting X-Trace into Ethernet is not possible, due to its lack of extensibility. However, X-Trace metadata can easily be stored in a shim layer above Ethernet, but below other protocols. Since all of the hosts on a LAN make use of the same LAN protocol, it would be possible to deploy X-Trace enabled network devices within one enterprise without requiring higher level changes.
Tracing tasks is needed at one point or another in the development of distributed applications and protocols for debugging and verification. Like with standard logging subsystems, developers can integrate X-Trace into their applications. It is actually being used by the team developing DONA [16], a content-based routing scheme for the Internet.
While X-Trace has many uses, it also has limitations. We discuss those here, as well as other interesting aspects.
The examples and usage scenarios we implemented and described provide an indication of the usefulness of X-Trace in diagnosing and debugging distributed systems. However, the ultimate measure of success for X-Trace is when it can measurably help users and system administrators find problems faster than using ordinary tools, or problems that they wouldn't be able to find otherwise. We are working on moving in this direction, but such an analysis was beyond our means for this paper.
If the reporting infrastructure loses any reports, the effect to the graph will be the deletion of nodes and edges represented by that report. This might make it impossible to reconstruct the causal connections. In these cases, the reports sharing a common task identifier could be ordered temporally. Although not as descriptive, this linear graph might still pinpoint certain faults.
The structure and complexity of an application's task trees have a strong bearing on the amount of report traffic generated by X-Trace nodes. We mention three mechanisms that can limit the volume of this traffic. Sampling can limit the number of requests that are tagged with X-Trace metadata to a rate specified by policy. A low sampling rate is ideal for “always-on” tracing used to get a picture of the behavior of the network. Differently from independent sampling at each node, using X-Trace, each “sample” is a complete task tree. Since X-Trace reports are delivered out-of-band, they can be batched and compressed before transmission. Within our network we have observed a 10x compression factor for X-Trace generated reports. Finally, scoping can be used to limit report generation to certain network layers, devices, or parts of the network. Layers such as IP generate many reports per request, since reports are generated on a per-packet basis. By limiting the scope of reports to those layers above IP, a smaller volume of reports is generated. Of course, if a fault is suspected at the network layer, the scope of reports could be widened to include IP packets of interest (say, from a client or subnet experiencing the observed problem). Currently, support for scoping is statically configured into the reporting infrastructure. Improving this support is considered future work.
The X-Trace metadata described in this work assumes that requests follow a tree structure. For the protocols and environments we considered, this assumption generally holds. However, other types of requests may not be captured. Examples are quorum protocols, or a controller which sends jobs to many working nodes and waits for all to complete. We are currently looking at extending the TreeInfo field to accommodate this.
Thus far, our discussion has focused on a comprehensive deployment of X-Trace throughout the network. However, even when X-Trace is partially deployed within one particular application or network layer, it still provides useful tracing benefits. For example, by integrating X-Trace into the I3 and Chord overlay networks, users of those system can track the mapping of I3 messages to Chord nodes. Alternatively, the developer of a middleware system could use X-Trace to follow requests from one node to another. In this spirit, researchers developing the DONA [16] project are making use of X-Trace to aid in the development of their new routing protocol.
Secondly, specific ADs can deploy X-Trace within their networks without requiring any cooperation or support from other ADs. For example, a service provider could deploy X-Trace at strategic points within their datacenter. This provides the service provider with the task tree within their network. We see the adoption of X-Trace following this partial deployment strategy.
It is important to discuss the potential for attacking the X-Trace infrastructure, as well as using that infrastructure to attack others.
First, one could mount an attack against an infrastructure that implements X-Trace by sending an inordinate amount of traffic with X-Trace metadata requesting reports. We argue that propagating metadata on its own is unlikely to become a bottleneck in this situation. Generating reports, however, could become a significant source of load. A simple defense is for each device to rate-limit the generation of reports. Still, malicious clients could get more than their fair share of the reporting bandwidth. If this becomes a problem, and filtering specific sources of reports becomes an issue, providers might start requiring capabilities in the options part of X-Trace metadata to issue reports.
Another possible attack with the reporting infrastructure is for a malicious user to send packets with X-Trace metadata, with the destination for reports set as another user. In the worst case, many network devices and hosts would send reports towards the attacked user. While this attack is possible, it will not have an exponential growth effect on the attacker's power, as legitimate reporting nodes will not place X-Trace metadata into X-Trace reports. Most important, however, is that we do not expect a large traffic of wide-area reports: as we describe in Section 2.3, we expect ADs to generate very few wire-area reports with pointers to detailed, independent stores for local reports within each AD. Lastly, this problem is more prevalent when the destination for reports are IP addresses. Using wire-area destinations like I3 or OpenDHT leverages these systems' denial of service prevention features. X-Trace keeps control of report generation rate and visibility with each report provider, which allows for defense mechanisms to be put in place.
A number of tools focus on monitoring network status, aggregating data from many devices and layers. X-Trace differs from these tools in that it traces, across devices and layers, the actual paths taken by data messages, rather than trying to get snapshots of the network infrastructure as a whole. One such tool is traceroute, which traces IP network paths. SNMP [7] is a protocol that lets operators inspect instrumentation data from network devices such as packet counts and error conditions. HP Openview is an example of an enterprise-wide network management tool that makes use of SNMP data. Openview can coordinate views at different granularities, as well as coordinate network policy changes. Cisco Systems' Netflows [18] also provides device instrumentation, although at a finer granularity than SNMP.
Splunk [23] is a commercial solution that collects and indexes all logs of an IT installation, allowing administrators to interactively search these logs in a flexible way. With knowledge of common log formats it is usually possible to follow tasks through the logs with hints such as IP addresses, user names, and timestamps. However, this approach is unlikely to work across organizations, and is not guaranteed to have the relevant causal connections. Properly propagated X-Trace metadata added to logs can greatly enhance the search power of such a tool.
Hussain et al. [14] present a system for performing high-speed network traces at a large scale. The purpose of their work is to collect the data, process it according to anonymization policies, and make it available for multiple users. That work focuses on traffic in the network, and not on capturing causal connections between requests at different layers. Kompella et al. [15] present a service for collecting “cross-layer information”. The focus of that work is on collecting control path state at different layers. Using the information their system collects, one could identify how failures at one layer impact other layers. X-Trace differs from that work in that we require widening the APIs at each layer, and focus on the datapath, rather than the control path.
The Application Response Measurement (ARM) [3] project annotates transactional protocols in corporate enterprises with identifiers. Devices in that system record start and end times for transactions, which can be reconciled offline. ARM targets the application layer, and its focus is to diagnose performance problems in nested transactions.
Pinpoint [9] detects faults in large, distributed systems. The authors modified J2EE middleware to capture the paths that component-based Java systems took through that middleware. They can mine collections of these paths to infer which components are responsible for causing faults. Our work focuses on recovering the task trees associated with multi-layer protocols, rather than the analysis of those recovered paths.
Aguilera et al., in [1], find anomalous behavior in distributed systems by treating each component as a black box, and inferring the operation paths by only looking at message traces. They present heuristics to recover the path given the timing relations among messages. A follow-up work, Pip [20] is an infrastructure for comparing actual and expected behavior of distributed systems by reasoning about paths through the application. They record paths by propagating path identifiers between components, and can specify recognizers for paths that deal with system communication structure, timing, resource consumption. Pip is targeted at a single distributed application, under the same AD, and does not capture cross-layer correlations. X-Trace is complementary to Pip in this sense. We believe that some of Pip's analysis can be performed on X-Trace's task trees.
Magpie [6] is a toolchain that works with events generated by operating system, middleware, and application instrumentation, correlates them, and produces representations of paths through a system by inferring causal relations from a total ordering of events. Instead of unique identifiers, Magpie relies on experts with deep knowledge about the system to construct a schema of how to correlate events in different components. Like X-Trace, they correlate lower level events with a higher level task, but focus mostly on a single system or on distributed systems that are highly instrumented in a compatible way.
The recent work in the AND and Constellation projects [4], defines the Leslie Graph as the graph representing the dependencies a distributed system's components. They use inference techniques to unobtrusively find correlations in traffic entering and leaving each node or service, and combine these findings in a network-wide graph. This graph is similar to, but different from our task trees: X-Trace produces deterministic traces of individual task executions, that are useful for examining their individual characteristics. In our ongoing work, we are looking into aggregating several task trees to determine aggregate behavior and dependencies.
Finally, Causeway [8] and SDI [19] provide mechanisms for automating metadata propagation within operating system and application structures, and could be used in some scenarios to ease X-Trace metadaa propagation.
Internet applications are becoming increasingly distributed and complex, taking advantage of new protocol layers and middlebox functionality. Current network diagnostic tools only focus on one particular protocol layer, and the insights they provide on the application cannot be shared between the user, service, and network operators. We propose X-Trace, a cross-layer, cross-application tracing framework designed to reconstruct the user's task tree. This framework enables X-Trace enabled nodes to encode causal connections necessary for rebuilding this tree. The trace data generated by X-Trace is published to a reporting infrastructure, ensuring that different parties can access it in a way that respects the visibility requirements of network and service operators.
We deployed and evaluated X-Trace in two concrete scenarios: a web hosting site and an overlay network. We found that with X-Trace, we were able to quickly identify the location of six injected faults. These faults were chosen because they are difficult to detect using current diagnostic tools.
The data generated by X-Trace instrumented systems can serve as the basis for more sophisticated analysis than the simple visualization and fault detection shown here. Using this data for new and existing algorithms [9, 20] is the object of our ongoing work. Given that the provider of reports ultimately controls how much data is generated, we are also investigating strategies to push filters on what to report as close to the sources of data as possible. For example, an AD could push a filter to all of its reporting daemons to not send reports on the IP layer.
We would like to thank our shepherd, Brad Karp, the anonymous NSDI reviewers, as well as Gautam Autekar, Matthew Caesar, Teemu Koponen, Armando Fox, Jeff Mogul, Sylvia Ratnasamy, Sean Rhea, Dick Sites, Nina Taft, and James Zhang for all the insightful comments and discussions.
This work was supported by NSF Grant CNS-0526016 (“NeTS-NBD: Collaborative Research: Intelligent and Adaptive Networking for the Next Generation Internet”), the California MICRO Program (“06-146: Enhanced Networking Dependability via Programmable Network Elements”), and with matching industrial support from Hewlett-Packard, Microsoft, and Sun Microsystems.
This document was translated from LATEX by HEVEA.